How to Read Marco Island's Vacant Lot Numbers
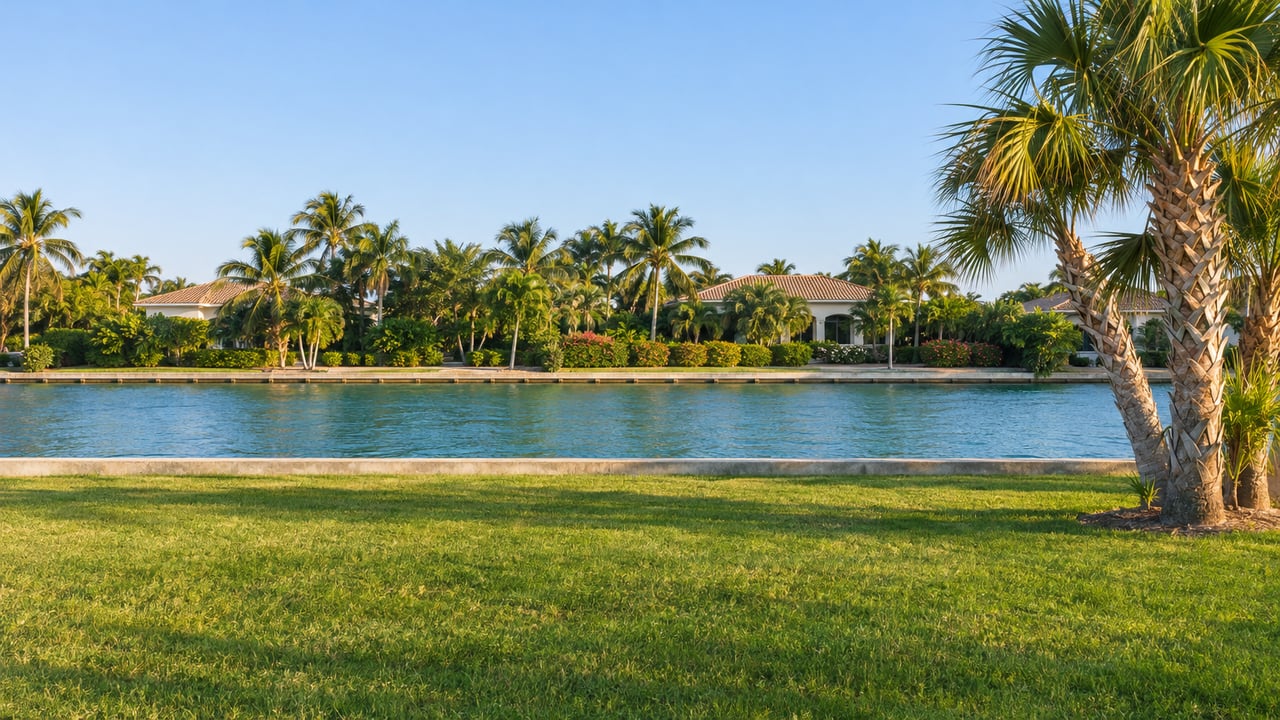
If the median price of a Marco Island homesite nearly doubled in a year, why did the average lot take more than 17 months to sell?
The Marco Island Area Association of Realtors published both numbers in the same paragraph of its October 2026 market report. The median sale price for vacant lots zoned for single-family homes rose 97% to $780,000 compared with October 2025. In that same month, vacant lots averaged 524 days on market. A lot owner reading the first number could easily add a large premium to an asking price. A buyer reading the second could expect to name their terms. Both readings go wrong for the same reason. The lot market on Marco Island is small enough that its monthly median depends mostly on which few lots happened to close.
The rest of the island moved the other way in October 2026. The single-family home median fell 16% to $1.5 million and the condo median fell 20% to $600,000, both compared with October 2025. Across homes, condos and lots together, active inventory dropped 23% to 380 properties, closed sales fell 13% to 48, and average days on market rose 70% to 242. Total sold volume was down 17% at $63 million, and vacant lots were the only category whose sold volume rose.
Those 380 listings and 48 sales are islandwide totals. They cover every property type MIAAOR measures, so they say very little about land by themselves. Land is a much thinner market, and that thinness explains the 97%.
MIAAOR's 2025 monthly reports list lots separately, and they show how few lots actually close in a typical month.
| Month | Lots sold | Lots in inventory | Lot median price | Change vs. prior year | Avg. lot days on market |
|---|---|---|---|---|---|
| March 2025 | 2 | 82 | $1.2M | +5% | 144 |
| May 2025 | 2 | 83 | $1.3M | +218% | 256, up 152% |
| September 2025 | 5 | 71 | $700K | -49% | 127, down 75% |
In May 2025, two closed lot sales were enough to produce a 218% jump in the median. Four months later, five sales produced a 49% drop. September 2025's five lot sales were reported as a 400% increase over the same month a year earlier, which means September 2024 had a single lot sale.
With two sales, the "median" is just the midpoint of two specific properties. If one is a large lot on open water and the other is an interior lot on a quiet street, the median falls between two very different products. A year later, if both closings happen to be premium parcels, the percentage change looks dramatic even though no individual lot gained value. October 2026's 97% sits in that same pattern. It shows which lots closed that month. It does not show what the lot in front of you is worth.
Days on market behaves the same way, and averages make it worse. A single lot that sat on the market for several years and finally closed can lift the monthly average by itself. The 524-day figure for October 2026 shows that some lots that closed had been listed for a long time. It does not mean every listed lot is stuck.
The headline numbers create friction during an actual land transaction, because each side can find a figure that supports its position:
For a seller weighing a list price, a home valuation built on lot-by-lot comparables answers the question the monthly median can't.
If the monthly lot median mostly reflects which lots happened to close, a better measure of demand is how many people are actually committing to build. The City of Marco Island publishes building statistics in its Community Affairs reports to City Council, and the Collier Building Industry Association reproduces them month by month in its Collier by the Numbers tracker.
| Month | New single-family permits, 2026 | New single-family permits, 2025 | Teardown permits, 2026 | Teardown permits, 2025 |
|---|---|---|---|---|
| January | 13 | 8 | 3 | 3 |
| February | 2 | 11 | 0 | 5 |
| March | 5 | 4 | 1 | 6 |
| April | 8 | 8 | 11 | 7 |
| May | 7 | 7 | 2 | 5 |
| June | 7 | 12 | 8 | 10 |
| July | 16 | 6 | 8 | 3 |
| August | 18 | 6 | 9 | 0 |
| Jan–Aug total | 76 | 62 | 42 | 39 |
Each permit counts a decision to build, so the series doesn't depend on which few lots happened to close in a given month. From January through August 2026 the city issued 76 new single-family permits, compared with 62 in the same eight months of 2025. Most of that increase came in July and August 2026, when monthly permits reached 16 and 18 against 6 in each of those months a year earlier. Teardown permits were nearly flat across the period, at 42 versus 39, so the higher permit count is not simply a wave of demolitions. Waterfront improvement work was also busy that summer. The city issued 80 seawall or dock permits in August 2026, compared with 50 in August 2025.
A permit stands for an owner who has bought land or cleared an older house, hired a designer and builder, and filed plans. This is a commitment made months before construction starts. The permit series doesn't tell you what any lot is worth, and it doesn't separate homes built on vacant lots from homes built after a teardown. It does show that, through August 2026, more owners were committing to build new homes on the island than a year earlier, during the same period when islandwide sales counts were falling.
Completions tell a slower story. The city recorded 78 new single-family completions from January through August 2026, compared with 80 in the same months of 2025. The homes finishing now were permitted earlier. The higher summer 2026 permit counts would show up as completions later.
The islandwide numbers set the general context. A specific lot is priced by the closings that resemble it. On Marco Island that means looking at a long window of comparable sales, often well beyond one month or even one quarter, because in the 2025 reports two to five lots closed in each month that listed them. Inventory also matters. MIAAOR counted 82 lots for sale in March 2025, 83 in May 2025 and 71 in September 2025. When dozens of lots are listed and only a few close each month, the listings a buyer competes against usually say more about price than the last month's median.
For buyers, comparing a lot with the active listings that resemble it, and with the closings of similar lots over the past year or more, gives a clearer price range than any single report. Our buying page covers how we set up those searches, and our Marco Island neighborhood guide gives the broader picture of the island.
For sellers, the July and August 2026 permit counts suggest that building activity was rising through the summer. How that applies to a particular parcel still depends on how the lot compares with the ones that actually closed. Our selling page explains how we prepare and position a listing.
No. The October 2026 figure compares the midpoint of the lots that closed in October 2026 with the midpoint of those that closed in October 2025. In 2025, monthly lot sales ran from two to five in the months that broke lots out, so one or two unusual parcels can drive a change of that size.
The city includes building statistics in its Community Affairs departmental reports to City Council, posted with council agendas, such as the October 19, 2026 report carrying August 2026 figures.
MIAAOR says its stats become available after the 6th of each month for the prior month.
If you own a Marco Island lot or plan to build on one, Sunrizon Realty can pull comparable closings for your type of lot and show you what they mean for your price. Contact us to get started.
Real Estate Update
If you’ve seen headlines saying home sales are slowing down, you may be wondering: is this really a good time to sell? While the latest numbers show sales picked up s… Read more
You’ve got questions and we can’t wait to answer them.